
In this article series we describe the process of building our award-winning developer documentation site from discovery to development, with in-depth insights into our approach, decisions, plans, and technical implementation.
Welcome to part 4, where we take a look under the hood, discuss the technologies we used, how we built our auto-generated API Reference, and how we use GitHub for our docs as code workflow and more.
platformOS Instance
When developing a platformOS site or app, the process starts with setting up Instances. Instances have a URL, and they represent different development environments, like staging or production. For our own sites, like our documentation, we spin up the Instance and work in our codebase directly, but you can build a platformOS site using various CMS solutions built on platformOS (e.g. Siteglide or Insites) if you don’t want to fiddle with code.
Our documentation site has a staging instance for development and testing and a production Instance — the live site if all tests are green. It works with continuous integration and continuous deployment: it automatically runs tests, deploys to staging and then to production. Once done, it sends us a Slack notification. To support a small footprint deployment process, we use an asynchronous event-driven JavaScript runtime, Node.js.
Our codebase is on GitHub. Besides standard web technologies like HTML, CSS, JavaScript (including JSON and AJAX), we use a couple of languages like YAML, Liquid, and GraphQL in our code.
Pages and layouts
Documentation topics and other content like our Style Guide or Contributor Guide are Liquid pages, and the structure of pages is described in layouts. Pages have conditional sections, where you can decide what will be auto-generated for that particular page by setting specific flags in page metadata.
metadata:
  title: Contact
  description: Send us a message, and we will get back to you as soon as possible.
  questions: false
  feedback: false
  toc: true
  breadcrumbs: false
- questions: questions section on the bottom with contact us button - default: true
- feedback: block on the bottom of the page allowing readers to leave feedback - default: true
- toc: table of contents inserted on the right side - default: false
- breadcrumbs: path to current page from the root of our site - default: true
Steps in tutorials are auto-generated: place <div data-autosteps></div> inside of the page, and it will generate steps from h2 headings on that page.
Docs as code
We work with the docs as code approach, which means that we treat our documentation content the same way as we treat our code. Documentation content goes through the same workflow stages and review process in the same tool, which is GitHub in our case.
We extended this approach to all aspects of our documentation site, and now we handle the whole editorial workflow and project management in the same tool. We keep track of content needs and content production on the Issues interface and kanban board of our documentation repository on GitHub. All of it is public, so you can watch issues and contribute to them, too.
Contribution
Contributors can contribute in different ways:
- Contribute to an issue, add questions, suggestions, or other comments
- Open an issue
- Edit content or code and send a pull request
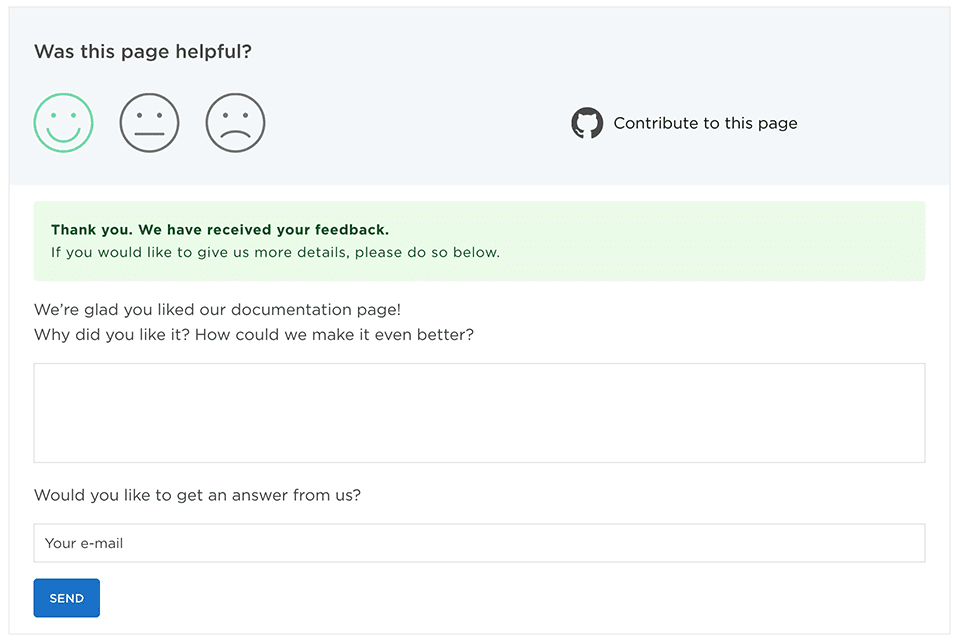
Users can contribute immediately from the page where they discover a problem or miss something by clicking on the feedback card. They can choose from two ways: 1. adding feedback or 2. contributing via GitHub. Clicking the “Contribute to this page” link opens the topic in the GitHub editor.
Auto-generated API reference
The information architecture of our API reference was based on an API documentation template we built using the results of our discovery phase, API documentation best practices, existing templates (that we also contributed back to) and feedback from our community.
Our REST API documentation is auto-generated, always up-to-date, and remote. We download the JSON file, parse it, and render and cache the view on the server. JavaScript is only used to highlight code snippets (asynchronously) and generate the table of contents.
Implementation
Table of Contents
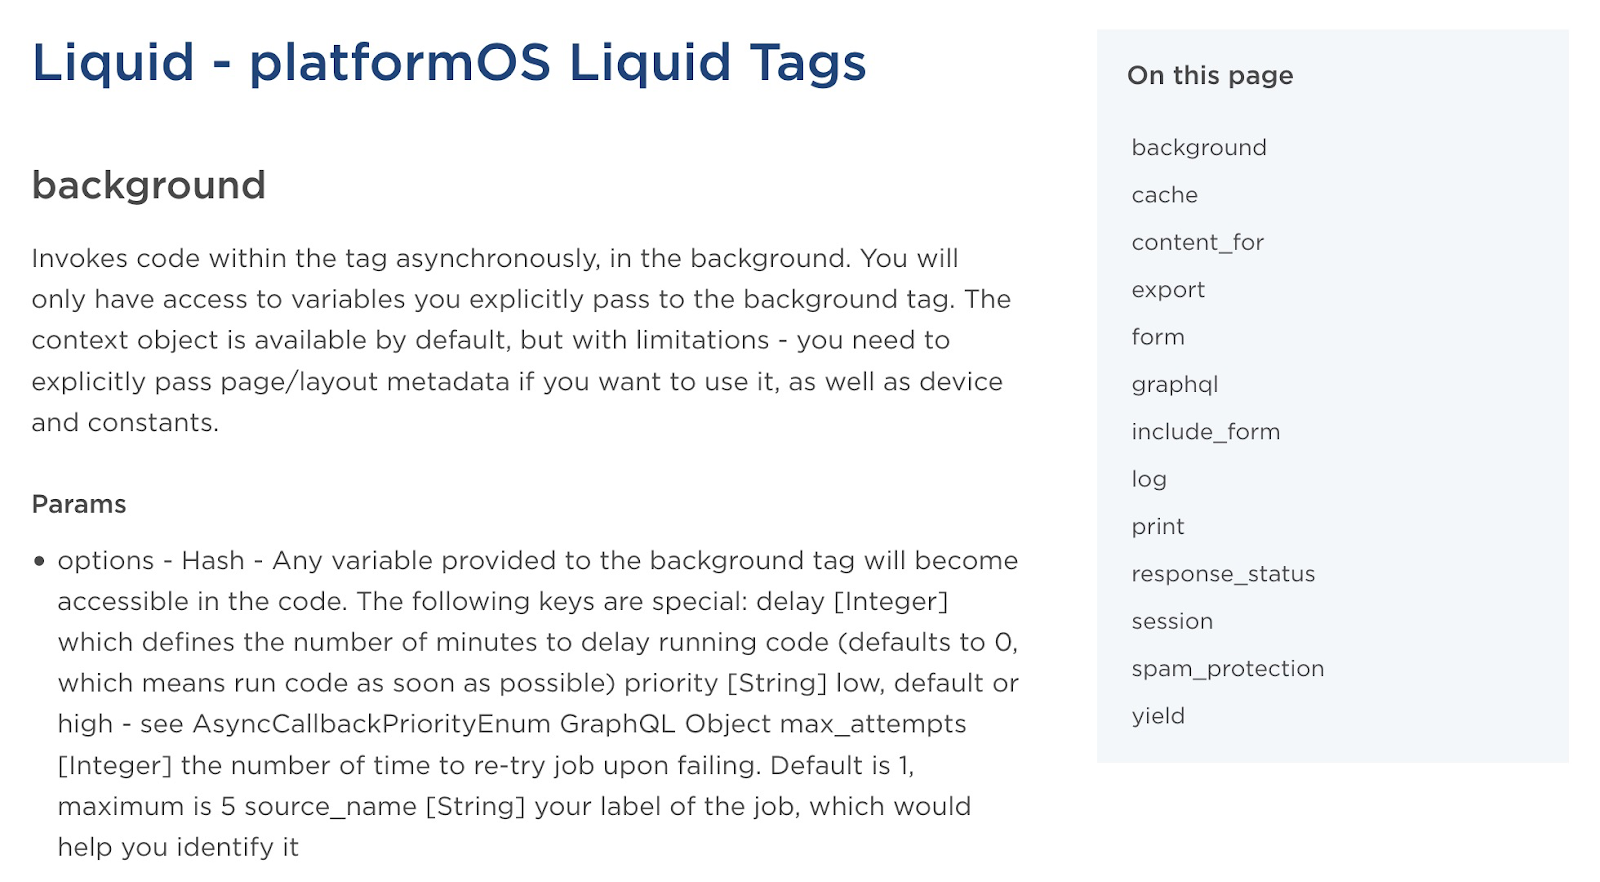
We build the ToC on our API reference using a script that looks for headings in the content, and generates a list linking to them, to make it easier and quicker to jump to the content you’re interested in. This only happens when an author of a page sets toc: true in the page metadata. This way we can control which pages will get this helper and which don’t - some pages are just too short to benefit from it.
Deep links
It is very convenient to link to specific sections of the page when you want to share a piece of information from a documentation page. Making links by hand and updating their anchors when text changes is very cumbersome, so we opted to automate that as well.
The link icon is added automatically to h2 and h3 headers, and the icons shows up when a user hovers over the heading.

Automated tests
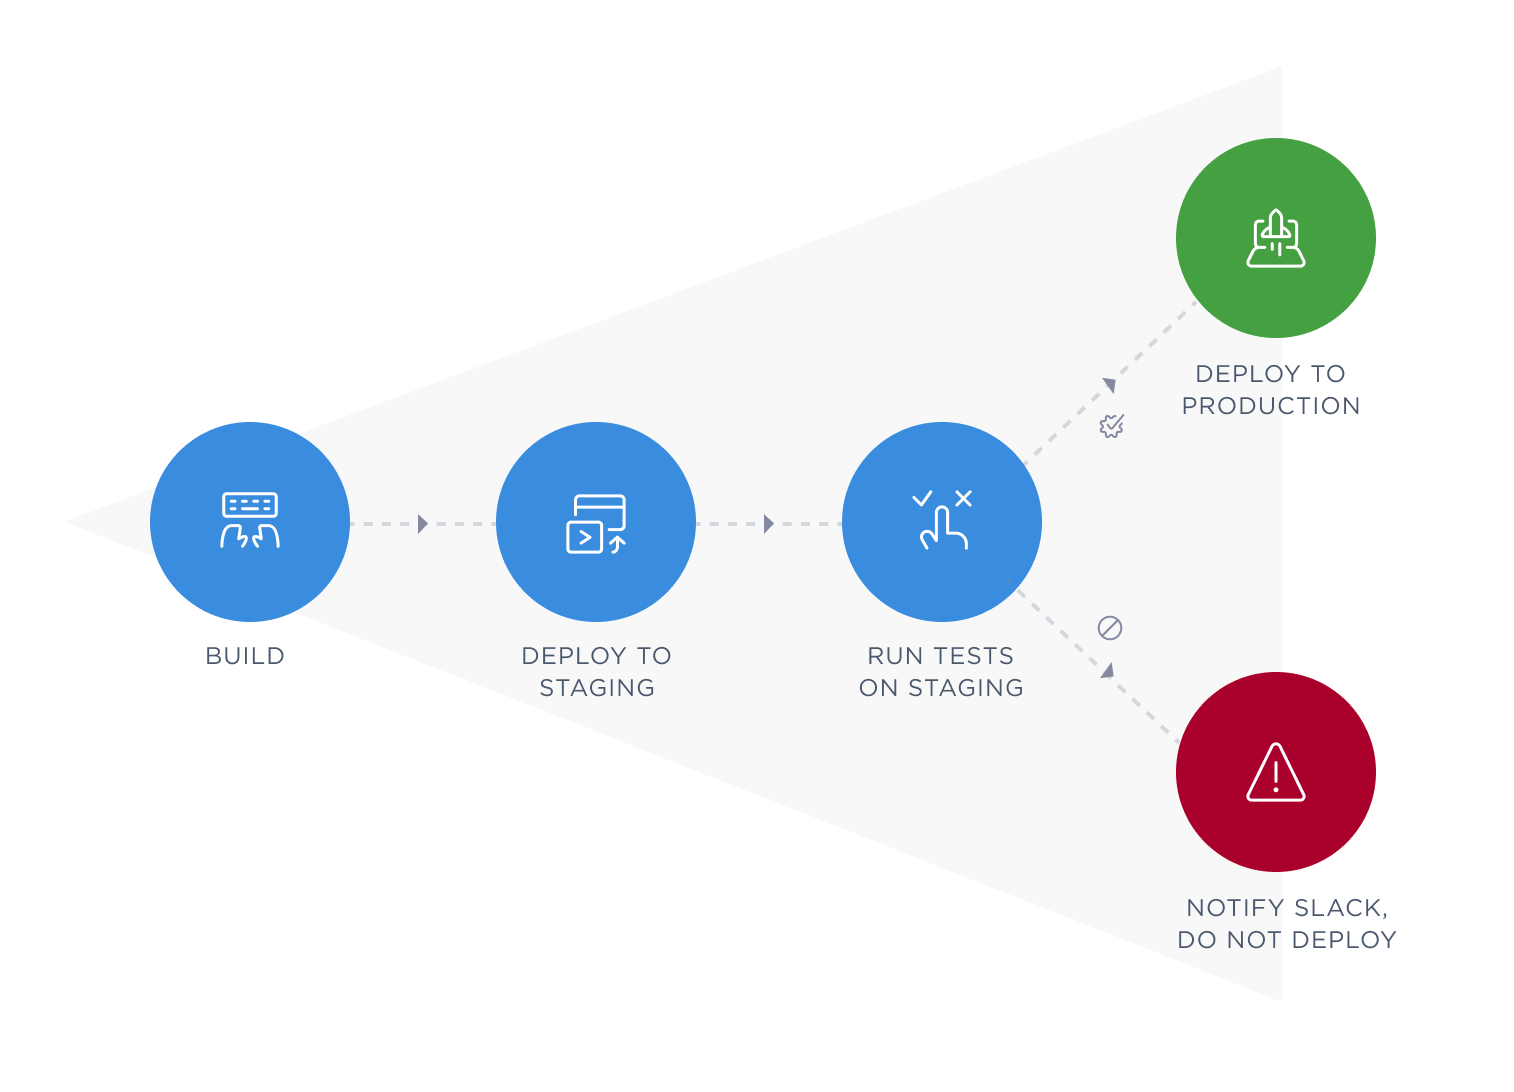
As part of continuous integration and continuous deployment, we automatically run tests on our documentation site on each push to master. These are the steps of our deployment process including testing:
- Build
- Deploy to staging
- Run tests on staging
- If tests passed: deploy to production
- If tests failed: notify Slack, do not deploy
We use the TestCafe framework for testing, because
- it’s fast, concurrency is supported
- both tests and the framework are written in JavaScript
- it comes with a Docker image so it’s easy to run on CI
- it has good documentation
- it is easy to extend with basic JavaScript knowledge
- it supports remote browsers (ie. BrowserStack, SauceLabs)
- it supports PageObject out of the box, which makes code organization easier
- it produces artifacts from failed tests (screenshots/video) on CI
- it has Roles which helps when there is a need to test two different users interacting
- waiting for the network works well, which is rare.
You can find extensive documentation on how to install and use TestCafe on our documentation site, including topics on writing tests, using the Page Object model and testing performance.
When testing our documentation site, we check these elements:
- Menu
- Lack of Liquid errors
- Presence of contributors
- Table of contents
We also test the platformOS Liquid output by comparing the output of filters/tags with what we expect and catch regressions. Last line of defense after examples MP tests and integration tests in the platform.
We test broken links with a broken link checker that we run every 12 hours. The broken link checker reports the results to our dedicated Slack channel.
In the near future, we are planning to implement performance testing with real user metrics.
If you’d be interested in learning more about our process and tools, check out our article series on QA and testing:
- QA and Testing Best Practices — Part 1: Our QA Process
- QA and Testing Best Practices — Part 2: Tips and Tricks
- QA and Testing Best Practices — Part 3: Speeding Up Development and Troubleshooting
- QA and Testing Best Practices — Part 4: Performance Testing
Performance
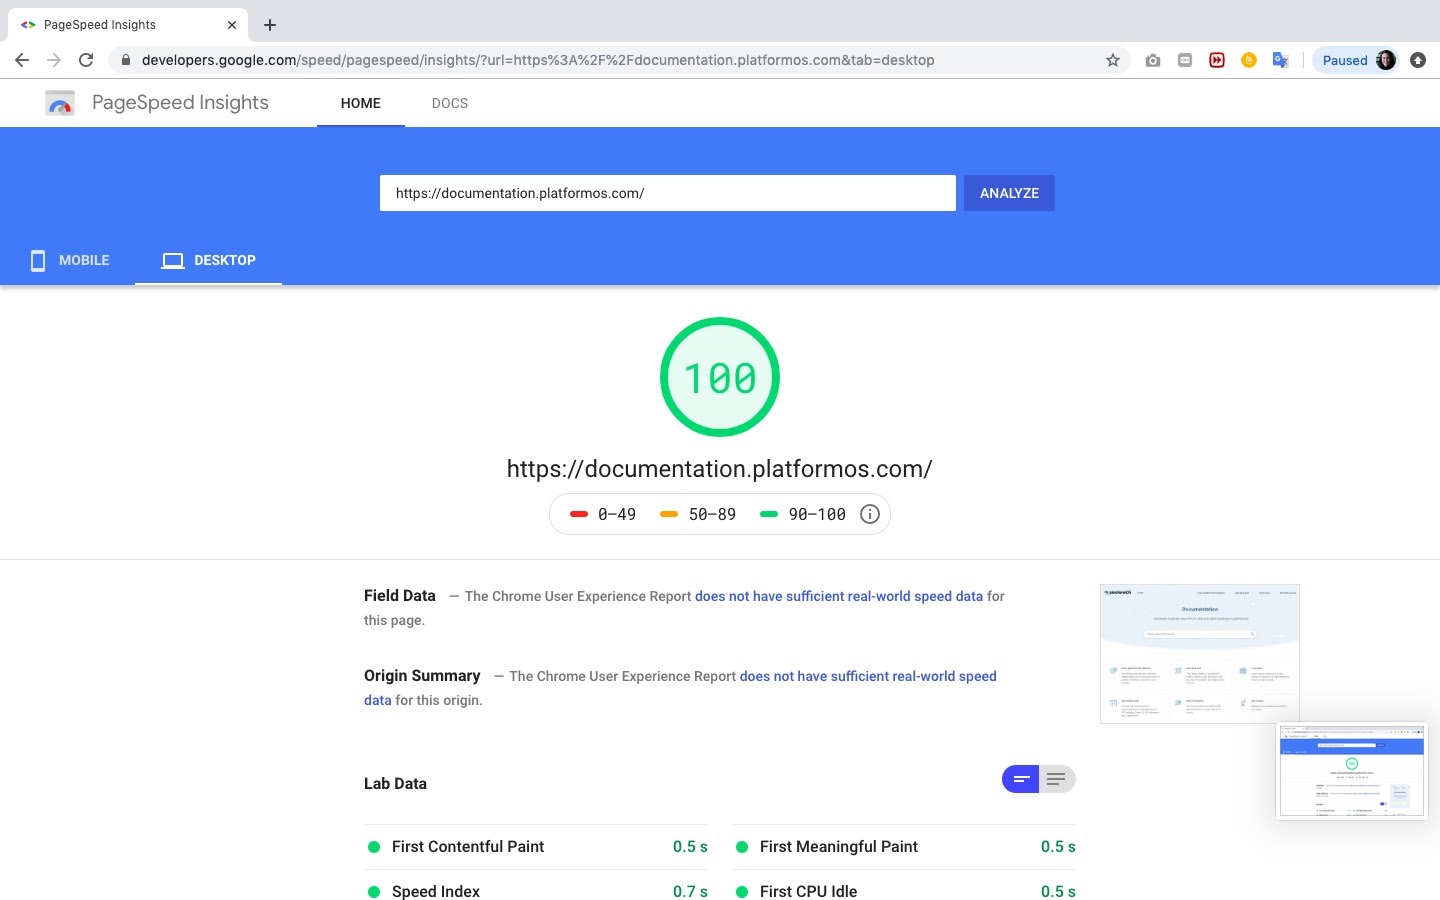
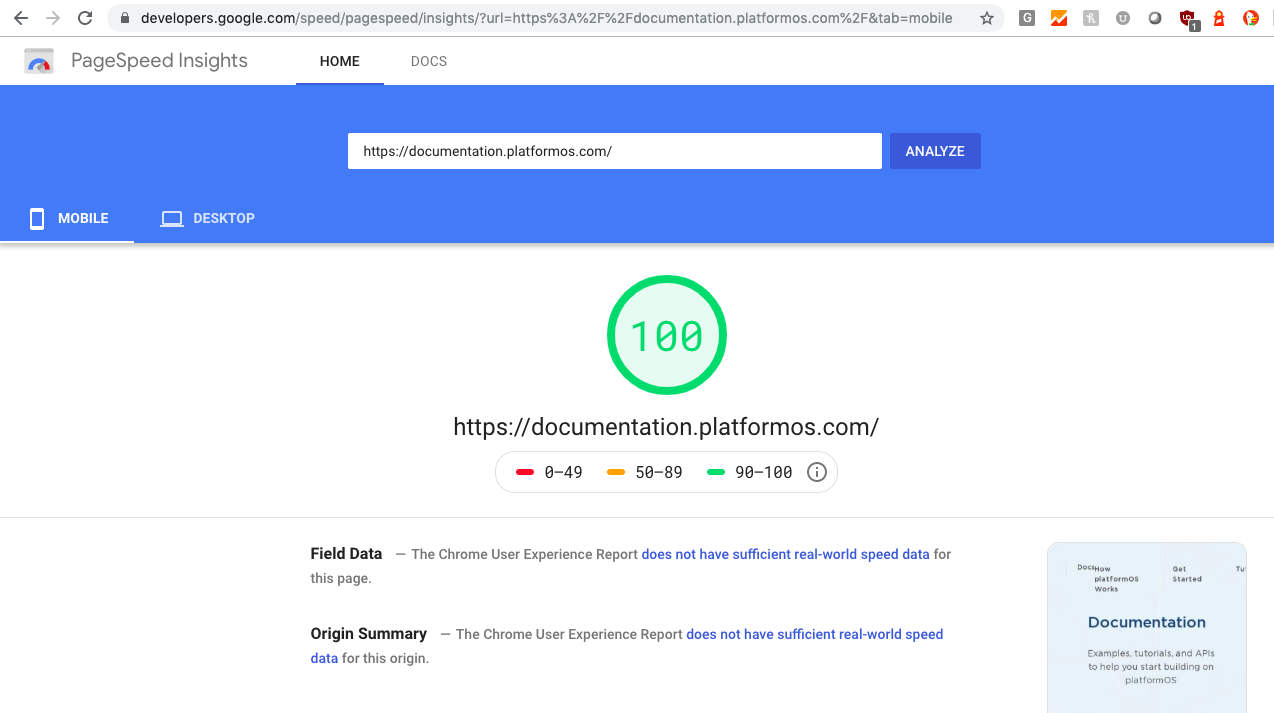
If you read our article about Code Quality and Performance Best Practices for Your platformOS Site, you know how good performance can help you keep visitors on your site, provide the best user experience, and rank high in search results. Our documentation is a high-performance site with a Google PageSpeed Insights score of 100 for both Mobile and Desktop, so we thought it could be helpful to dive a bit deeper into what tools we use and how we achieved this amazing performance.
Measure early, measure often
Before you start optimizing, you have an amazing opportunity to measure your current application performance using available tools. We recommend looking at them in this order:
- https://web.dev/: very easily digestible summary, uses Lighthouse underneath
- https://developers.google.com/speed/pagespeed/insights/: more detailed report, with additional recommendations, uses Lighthouse underneath
- https://www.webpagetest.org/: you can choose client location, record video, force multiple views to test caching, network speed and others — highly recommended if you know what you are looking for
- https://github.com/GoogleChrome/lighthouse-ci: run Lighthouse on your CI to test performance continuously
- Developer Tools: all of the above, inside any Chromium based browser, uses Lighthouse underneath
Export reports and repeat some of the measurements every month to see your progress. This can help correlate KPIs with web performance — but keep in mind that correlation does not equal causation.
Front-end checklist — track your progress
Front-end checklist is an excellent tool to track your front-end improvements progress. Checklists work well in teams if you can split work across multiple people. One person can handle SEO, while others can work on images and the performance sections of this checklist. All of them ultimately bring your application closer to being a successful project — making performance improvements a team effort makes the whole process even more satisfying.
Smashing Magazine recently published the Front-End Performance Checklist 2019. We highly recommend to read it from start to finish and come back to it often as a reference. It is available online and in various document formats. Most of the techniques used on our documentation page are described or at least mentioned in this article, so it should help you understand what we did.
There is also a community driven Front-End Performance Checklist that is basically a list of things to remember with links to resources that explain how to achieve the desired effects.
The most important performance questions when developing
When you have control over both the server-side and the front-end, you have great power — which comes with great responsibility. Choose what you do on the backend wisely.
Doing more on the backend will slow down your Time To First Byte, but usually will mean less side effects and quicker Time To Interactive. When you do more on the backend, after your feature is done, try caching the result if it can be done so easily and reliably. Sometimes caching is the only reason to move a feature from the backend to the frontend. For example, on our documentation page, we could not cache the main navigation because it had an active class on the current page menu, so we moved this part of the feature to JavaScript and saved around 50-100ms on rendering. 50ms doesn’t sound like much, but in this case it was an over 15% improvement.
If you decide to write some features in JavaScript, it will make your page bigger. Browsers will need to download, parse, execute and render that feature. This will usually mean quicker first meaningful paint, because you are basically lazy loading a feature from the server to asynchronous JavaScript. If you go this route, try not to block the main thread and use the Idle until urgent pattern by Philip Walton for minimized impact. Also see this video by Paul Lewis for more visual explanation.
What to avoid, how to fix mistakes
The most common mistakes we see in the wild are around build processes and decisions on dependencies.
Looking at the list below will help you think about the balance between size, convenience, and maintainability:
Do you really need the whole Bootstrap? Or any CSS framework at all? Maybe purgeCSS can help get rid off unused code.
- Do you really need a JavaScript framework?
- Can you format dates using modern APIs and provide conditional polyfill for legacy browsers?
- What if you introduce a new developer to the project?
- Is there any alternative that will not be dependency-heavy or will leverage native APIs?
Using some development and asset building techniques allows you to mitigate the downsides of including some dependencies. We think these are the most impactful:
- Dynamic code splitting (with lazy loading chunks that are used on specific sites)
- Tree shaking (smaller bundles)
- Serving ES6 bundles to browsers that understand them, because it is smaller in size, and ES5 transpiled code to old browsers. Read more about this technique in Using ES6 modules in the browser.
- Using modern features and Conditional polyfills (progressive enhancement) — verify browser support at caniuse.com
Jump to the Quick Wins section from the Front-End Performance Checklist 2019 to read about the recommended 12 low-hanging fruits.
What we did to achieve 100/100
Let’s explore the steps we took to ensure outstanding performance that made the perfect score possible for our documentation on Google Page Speed Insights:
- We replaced font icons with SVG icons. This improves rendering quality, it’s smaller and more flexible.
- We self-hosted Google fonts. The fonts are also optimized to include only characters used on the website. This means instead of additional 2 HTTP requests and over 400KB to download, there is no HTTP request (apart from the font files themselves) and only 20KB to download.
- We reduced third-party requests to an absolute minimum, even non-blocking ones. They can break performance of your website very quickly.
- We use two external tools: The excellent polyfill.io service and sentry. We decided to self-host raven (sentry client) to save DNS lookups. One day we might decide to move to a self-hosted polyfill service as it is open source.
- We strip every package we use to the bare minimum using both manual and automatic methods, like selective imports for bootstrap.
- We split code using webpack’s dynamic imports to asynchronously load heavy dependencies on demand (prismjs).
- We preload resources using the meta tag (JS, CSS, sometimes JSON with data).
- We use DNS-prefetching for domains that we will use (our CDN, polyfill service).
- We sometimes use inline SVG images to avoid http requests.
- We cache github contributors in the database to move this feature to server side and remove missing contributors when a user enters the page.
All of the above steps allowed us to get great results in both benchmarks and real user testing:
Desktop results 100/100
| First Meaningful Paint | 300ms |
| Time To Interactive | 600ms |
Mobile results 100/100
| First Meaningful Paint | 1.6s |
| Time To Interactive | 1.8s |
In the future, we are planning to use service workers to cache whatever can be cached for offline usage. We will also rewrite the frontend to TailwindCSS to get rid of Bootstrap.
Conclusion
We hope you enjoyed our article series about how we built our documentation site on platformOS. We provided some insights into our processes and implementation, but we are continuously changing and improving all aspects of our documentation, so by the time you read these articles, some things might have changed.
We collect user feedback through Slack channels, the feedback block, user research and interviews to make sure our documentation fits our users’ needs. Some areas we would like to focus on in the next phase:
- Onboarding: We will do a full overhaul of our onboarding, and have three distinct user journeys for the three main segments of our target audience (non-technical, semi-technical, technical).
- Design adjustments: We got a lot of valuable feedback on our design from both users and award juries, and we’re in the process of rolling out our branding to all of our sites, so we will do a design update on our documentation as well.
- Examples: The more examples, the better. We are continuously working on adding more examples and considering to incorporate our example library into our documentation site.
We’ve come a long way but there’s still a lot we can improve. Stay tuned, because we will write more articles to support you on your journey with platformOS.
This article was co-authored by Pawel Kowalski, Front-End Developer and Performance Advocate at platformOS, and was originally written for the PlatformOS Blog.